


Interference Theory of Music
By Richard Merrick
Harmonic Interference Theory
‘It occurred to me by intuition and music was the driving force behind that intuition. My discovery was the result of music perception.’ – Albert Einstein
The central question in music education and theory is how do musical scales, intervals and chords combine to create a sense of anticipation and resolution, or tension and release. Parallel to this discussion is what causes some intervals to sound pleasingly concordant while others are perceived as gratingly dissonant. These are the fundamental questions of our perception of music that Harmonic Interference Theory was developed to help answer.
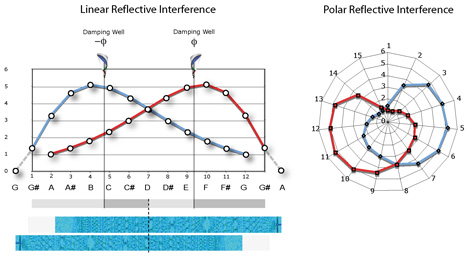
We begin by analyzing the pattern of two tones diverging at a constant rate from unison to an octave using what is called a ‘Blackman Spectral Analysis’ in Adobe Audition.

In this illustration, naturally concordant intervals are identified by vertical gaps in the overall pattern. These intervals correspond to simply harmonic proportions, such as 5:3 for a major sixth and 3:2 for a perfect fifth. Thinner gaps or regions with no gaps then identify dissonant intervals.
The question is then how can we describe the pattern of consonant gaps and what might this have to do with music perception.

As it happens, the distribution of gaps created by two standing waves as they interfere over a frequency-doubled octave can be described mathematically by an equation known as a Gaussian first derivative distribution. Most would recognize this as a the change in velocity along a Gaussian curve, popularly known as a ‘Bell curve.’
This first derivative Gaussian curve is very important in the study of human perception. Recent studies have found that the distribution of photoreceptors around the fovea centralis (or blind spot) in the eye follows a Gaussian derivative distribution. The Basilar membrane in the inner ear has also been found to focus itself according to a Gaussian first derivative. Even in the brain itself, neurons always fire in a Gaussian derivative wave.
It would seem that this harmonic interference curve is the one key pattern behind human perception. But its equation looks oddly complex and incomprehensible. Why would something so fundamental to perception and nature be so complex and ungraceful, even as it is clearly related to harmonic formation?
Fortunately, there is another way to describe this organic curve using something called a ‘Harmonic Interference Function.’
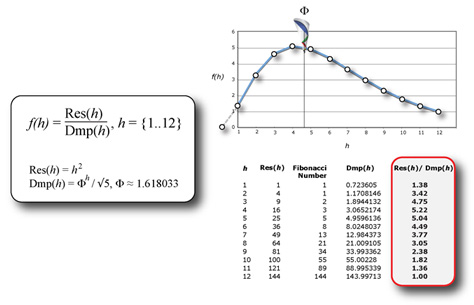
The same distribution of concordant gaps can be found by simply dividing the square of the harmonic series by the Fibonacci series. Since resonance can always be represented by squaring a round number and damping can be approximated by a Fibonacci spiral, the harmonic interference function helps us understand how nature balances itself between a close circle and infinite spiral.
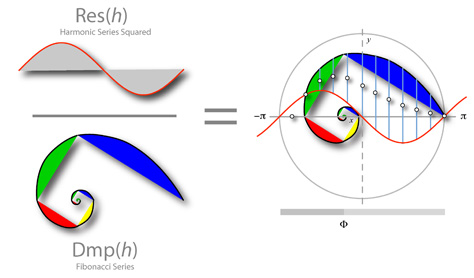
This can be visualized geometrically using a resonating surface and a Fibonacci spiral. As the spiral pushing into the resonating surface, the geometric mean between the two forms a Gaussian first derivative curve.
This many seem abstract and far removed from the subject of perception and harmonics – that is, until we recognize this geometry acts as a natural focusing function in the formation of life.
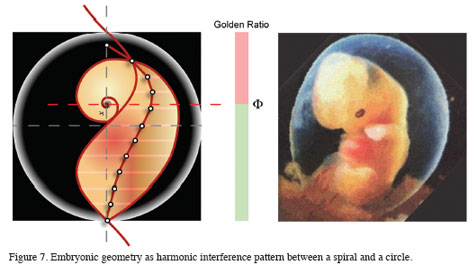
Since life too is a standing wave, oscillating in place with every heartbeat, the organic geometry of the body is the reason we developed senses that can perceive and recognize the world? And beneath this, it is the resonance of carbon and water under pressure that made it possible to focus on the world long enough so that Darwinian evolution could help us adapt to our environment. But as it concerns music, the harmonic interference function is the ‘built-in’ harmonic pattern that enables each one of us to instantly recognize music by focusing on melodies, anticipating harmonic resolutions and feeling the emotion of music simply by listening to it with our Fibonacci double spiral ears.
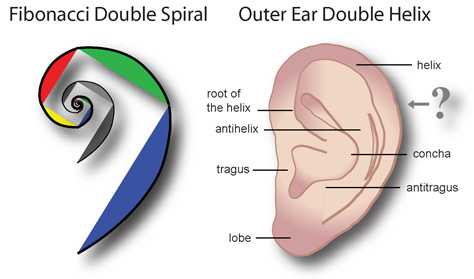
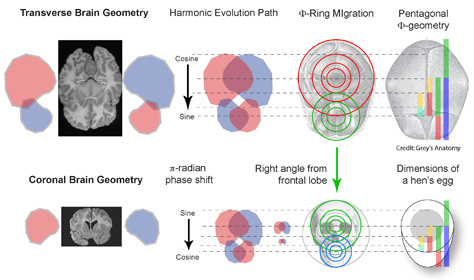
Between our two ears sits the mysterious brain. But, given that we have two ears mirror images of the other, would not one side of our brain also be a reflection of the other? Further to the point, wouldn’t our brain represent a reflection of the same harmonic interference function found in an embryo, just wound around a polar axis?
And, wouldn’t this interference geometry be found elsewhere in the body and all nature?
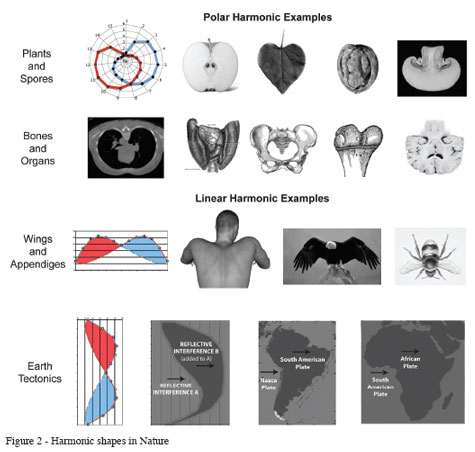
Indeed, reflective interference forms across frequency doubled domains can be found everywhere – from the leaves on trees to the fruit they bear to the animals that eat the fruit. The natural world is built out of interference patterns resonating up from the atomic level into an environment that is built out of the same interference patterns resonating down from the cosmic level. It is here where we meet in the middle between the closed circle and the open spiral.
Even our eardrums twist out of an open spiral to form a closed polar reflective interference pattern.
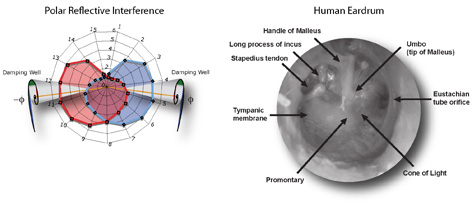
From the very first moment sound touches our Fibonacci ears, they begin focusing on harmonic proportions. They do this by first using a spiral to cancel out unwanted wave reflection, creating an environment for the recognition of coherent sound.
As they drill further inward, they blossom into the same pattern in our brain, which is repeated like puzzle pieces at different scales in the head.
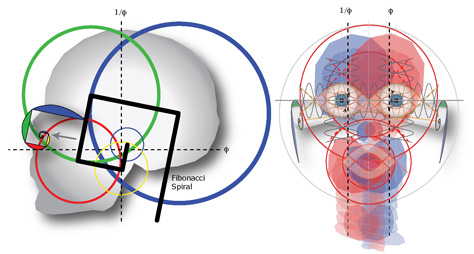
What we find is that our head is really a fifth appendage that has curled around itself like a clenched fist. In the process, it opens up the sinus cavity and pushes cell growth forward to form the peculiar geometry of a nose.
The spiral of polar reflective interference patterns eventually break through the cranial eggshell at the base of the brain and shoot down into a wave-like spine to create the music of the body. All of this ends in perception, cognition and consciousness – a direct result of the architecture of our nervous system and a harmonically structured body.
From Harmonic Interference Theory, we can use the reflective interference distribution as simple metrics to measure fundamental perceptual qualities in music. Tension and resolution can be measured as a dynamic and temporal differential function gauging the velocity of energy currents (resonance).
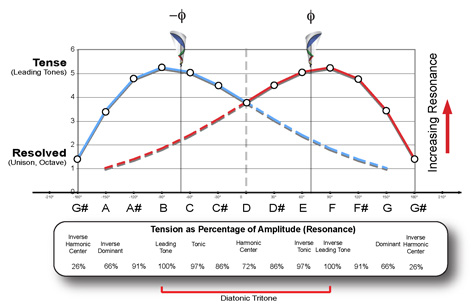
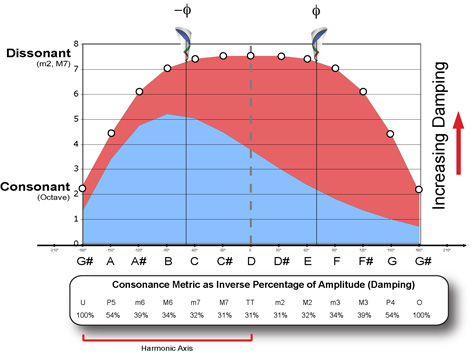
Similarly, consonance and dissonance can be measured as a static and spatial integral function gauging the combined area occupied by energy currents (damping). Thus the perceptual qualities of tension and dissonance can be considered separately, one in time and the other in space – yet, both part of the same physical model.
Perception is first and foremost a result of the geometry of the body and Gaussian distribution of cells resulting from the bonding patterns of water and carbon. This distribution is driven from the atomic level up, manifesting step-wise in stages to create the basic shape and taxonomy of each organism.
As evidenced by our conscious self-awareness, we human beings are among the most resonant and harmonically balanced organisms on Earth. For this reason, our most primordial perceptions and emotional responses can be measured and predicted using a spectral harmonic function.
But while the reflective interference model can be used to measure the perceptual qualities of music, we might wonder if scales, chords and intervals inherit this from a pattern deeper in sound. Could the spectral interference pattern of two tones diverging over an octave simply be the visualization of a pattern already existing inside the harmonic series of a single tone? That is, could the single tone produced by a plucked guitar string have this same Gaussian distribution pattern inside of it?
The answer is YES, it does. We can prove this by measuring the proximity of each harmonic to the points of maximum resonance and damping in a standing wave.
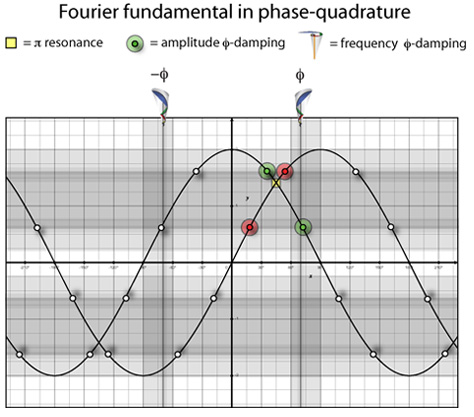
To measure maximum resonance, we must identify the point where a Fourier wave adds together to create the standing wave’s maximum amplitude. This is marked by a yellow square in the diagram.
For maximum damping, we identify both the frequency and amplitude damping locations that are golden sections (and its inverse) of the waveform. These are marked by 16 dots and 2 vertical lines in the diagram, but due to periodicity just 4 dots can be used to measure proximity.
In this way, this Timbral Proximity Method can be used to order harmonics according to their resonance and damping qualities. This can then be compared to the tension and consonance metrics to see if they agree or not.
Using this diagram as a master template, each harmonic frequency is superimposed to measure its proximity to one or several of these points. Each harmonic is unique in how it aligns near these different locations. However, only the 9th harmonic partial aligns with ALL of the points of maximum resonance and damping. Coloring the intersections with red and green, Partial 9 lights up the proximity plot like a Christmas tree.
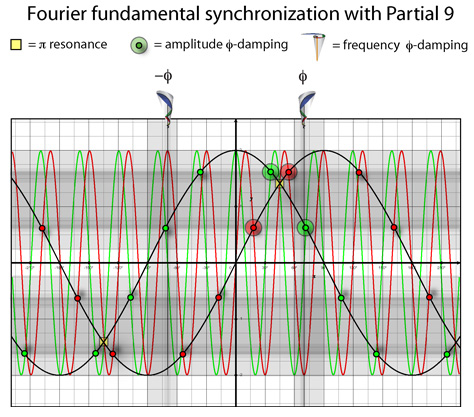
This perfect alignment in the plot means Partial 9 acts as a kind of surrogate or twin for the prime resonant frequency of the fundamental wave. More than this, it acts as a polar axis with the fundamental frequency around which all of the other harmonics balance and ‘orbit.’ For this reason, Partial 9 can be designated as the Harmonic Center in any standing wave while the axis formed with Partial 1 becomes a Harmonic Axis.
Taken as a numerical proportion, 1 : 9 equals 0.1111111111… while squaring it into the proportion 1 : 81 reduces to 0.012345679…
In these simple proportions we find the synchronization exhibited in the physical intersections of the 9th partial to the fundamental period reproduced in the behavior of numeric division. The number 9 splits out Unity (or singularity) into an infinite number of copies of itself while resonating it into a 9 x 9 square splits (or refracts) Unity into the harmonic series (sans octave 8).
This simple correspondence of physical wave intersections to mathematical proportions appears to be at the bottom of the many legends surrounding 8 and 9.
The Chinese consider 8 to be an auspicious and very lucky number. Things repeat in frequency-doubled octaves. The center ball in a game of billiards is 8. In mathematics, square-free ‘sphenic numbers’ used to describe periodic functions like Möbius strips and cyclotomic polynomials always have 8 divisors. This means that periodicity in nature is a function of 8, emerging from the cube of 2 (expressed as 23).
At the same time, multiples of 9 are used in the symbolisms of ancient temples to represent heaven and eternal life, translated into modern times as the legendary nine lives of a cat and the bliss of living on ‘cloud nine.’ Nine is a harmonic twin or reflection of Unity in the harmonic series of a standing wave, conjuring up the idea of an invisible parallel reality. Thus, scalar recursion in nature is a function of 9 or 3-squared (expressed as 32).
So we have 23 and 32 as the two basic powers describing how harmonics cycle in space and nest in time.
Returning now to Partial 9, we can see it acting as a Harmonic Center once the harmonics surrounding it are mapped out in table form.
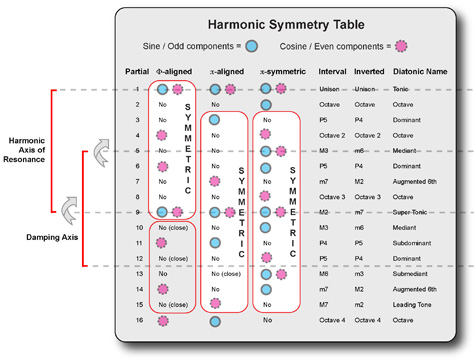
Here we see two group symmetries of 13 harmonics each balanced around Partial 9, forming a Harmonic Axis with the fundamental Partial 1 to induce coherent resonance. At the same time, we find another group symmetry of 9 harmonic partials balanced around Partial 5, forming an anti-harmonic damping axis with the center of another near-symmetry group of 6 harmonics.
In this way, we can begin to see how the harmonic series in a standing wave unfolds and balances around its Harmonic Center much like the planets balance around our Sun. We can also see how the timbral components in a single vibrating string correspond to the symmetry and unfolding of intervals in an octave.
For instance, the Super Tonic or ‘ninth’ in music harmony corresponds directly to Partial 9 in the harmonic series of a single tone. In this way, the Super Tonic acts as the Harmonic Center of a diatonic scale and traditional music harmony. You can prove this to yourself on a piano keyboard by finding the point of symmetry in a C major scale. You will find it to be the Super Tonic D – the same tone corresponding to Partial 9 in the harmonic series of tonic C and commonly known as the ‘ninth.’
Perception of musical scales appears to be directly connected to the physiological recognition of symmetry induced in the brain’s neural patterns by sensory input. The brain’s symmetrical reflective interference geometry, a product of carbon-water standing wave patterns crystallized into brain tissue, are able to instantly pattern match and measure incoming sound patterns that employ an identical interference pattern. More significantly, the same sensory apparatus is used to pattern match at different scales in sound, simultaneously recognizing timbre and harmony at two different resolutions of harmonic interference.
From this timbre-harmony equivalence principle, we can deduce a 5-level hierarchy that unifies these scales across the entire human spectral auditory range as follows.
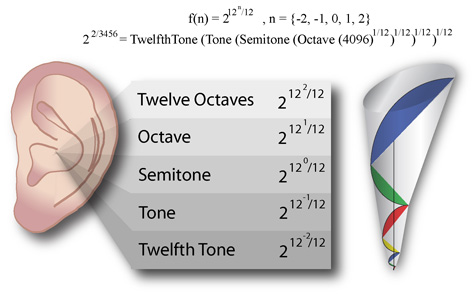
This hierarchy is really a continuation of the earlier discussion concerning Phi-recursive heterodyning of harmonics. Each cognitive level is equivalent in its geometry and general emotional effect, even while perceived distinctly at each resolution. Overall, the structure can be modeled as a 3D projection screen organized as 2 to powers of 12 divided into 5 discrete scales of resolution. This bubbles up from inside the narrow proportion 22/3456 that forms around the Phi-eigenvector of a standing wave.
In summary, Harmonic Interference Theory explains music perception as the simple organic process of comparing sonic geometric patterns against the body’s own physiological geometry, more specifically that in the auditory system. The key principles are:
- The brain and senses are a harmonic focusing system based on the model of a standing wave,
- Perception occurs by matching interference patterns in the environment with a standardized reflective harmonic pattern in the brain,
- Emotional responses in music are triggered by the direction and velocity of energy transferred between harmonics at Phi-damping locations,
- Dissonance is a static, spatial and integral perceptive quality while tension is a dynamic, temporal and differential quality, and
- Emotions can be measured and predicted by weighting and averaging the proposed interference metrics over time.
These findings can be extrapolated to explain all sensory perception. This, however, is an ongoing line of investigation.
Content courtesy of Richard Merrick
Copyright (c) 2011. All Rights Reserved.
